SMART III - Video Calibration Toolkit
Steve Smallcombe's SMARTAVTWEAKS site

Gamma Tracking
One of the other new and important features of SMART III is an accurate
measurement of the display's gamma and gamma tracking or its ability
to reproduce light levels accurately as a function of input or IRE level.
The relationship between input signal level and light output is not
linear, as one might expect, but follows an exponential function as
can be seen in the chart on the right. The exponent of this function
is referred to as gamma for the display. If the projector tracks the
desired function properly, then the image will appear as the director
intended with shadow details preserved at low IRE levels and highlight
detail maintained at the high IRE levels. If the projector's gamma tracking
is off, then details in the image will either be lost or the image may
look flat and have little contrast.
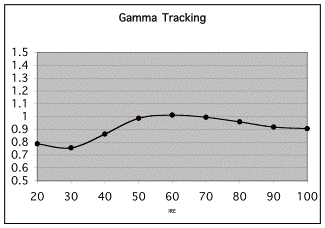
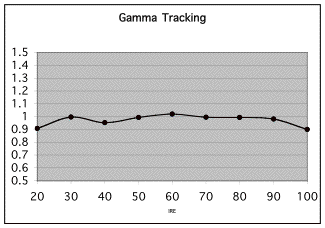
The Gamma Tracking charts used by SMART III show the ratio of the measured combined light level at a given IRE level to a theoretical level calculated. The calculated value is based on a target gamma value typically 2.2 to 2.5. If the projector is accurately producing the intended light intensity level as a function of IRE level. then the gamma tracking graph will show ratios at all IRE levels that are close to 1. If the projector is putting out less light than the ideal, then the gamma tracking chart will proportionally show a value of less than 1.


The Gamma Tracking charts above show the gamma tracking performace of the Epson TW100 in the Theater mode (left) and Natural mode (right). In the Gamma Tracking graphs above we can see that the TW100 with the Theater setting shows less light at the lower IRE levels than the ideal. While such gamma behavior will make for a dramatic dark image, it will, in fact, cause some loss of shadow detail. With the ‘Natural’, setting the gamma tracking was quite well behaved and produced good shadow detail. Getting gamma tracking right is an important part of calibrating a video projector as it assures not only the right overall brightness to the image as well as good shadow details and whites that are not crushed. SMART helps to detect and correct Gamma Tracing problems as well as Grayscale tracking problems.
Introduction to how SMART works
Frequently Asked Questions about SMART
Here is what's new is SMART III version 1.2
The Dummies Guide explains the SMART process in a non-technical way
Buy SMART III at EnhancedHT - your exclusive source for all SMART products
Having trouble? Learn the most common mistakes people make using SMART
Read about using bias lights to improve perceived black levels.
Here are some additional tips for the SONY projectors and solution to common problems.