SMART III - Video Calibration Toolkit
Steve Smallcombe's SMARTAVTWEAKS site


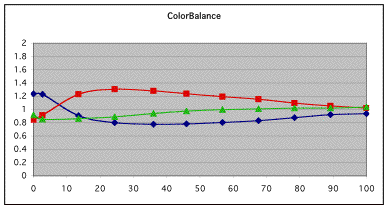
Color balance and grayscale tracking are shown in several ways with SMART
III. The Color Balance chart on the right shows color balance in terms
of the ratio of all three colors as a function of IRE level. This example
is from the Sanyo Z1 prior to SMART calibration. The picture in this state
of calibration (or lack thereof) looked too red, except in dark scenes
where the shadows seemed a bit blue. The Color Balance Chart is probably
the most useful chart for understanding what is happening to your projector’s
color balance at the various IRE levels.
From these
RGB ratios, however it is possible to calculate many other metrics including
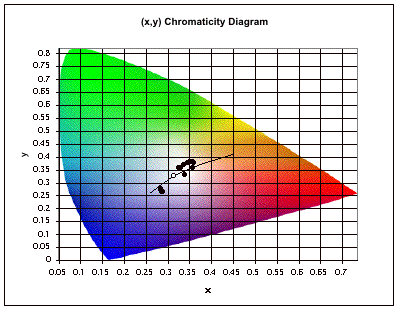
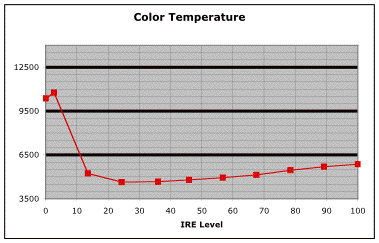
xy chromaticity values and correlated color temperatures as shown below.
These data for these particular charts were taken from a Sanyo Z1 spreadsheet
at the beginning of calibration and does not represent the projector as
ultimately tweaked. 
The three charts or diagrams show here show the same information, but in different ways. The SMART color balance chart allows you do directly compare RGB ratios at all IRE levels relative to the reference level at 1. The xy chromaticity diagram shows this same information, but in this case, transformed into the CIE color space. The reference point is shown as the unfilled circle near the middle of the diagram and represents the ideal, D65.
 The
Color Temperature chart shows again the same information, but in this
case, as a “Correlated Color Temperature” calculated from
the above xy coordinates. Note that is Color temperature diagram is probably
the least informative of the three, as the Correlated Color Temperature
is particularly insensitive to green in the regions of color space where
we will be operating. So you may find that during the calibration process,
the Color Temperature may read very close to the desired 6500, but that
the SMART Color indicates that green is either too high or to low. This
is because 6500K does not describe a precise location in color space,
(unlike D65) but in fact, a whole locus of lines that can have significant
variation in the green magenta balance.
You may also want to read the page on SMART and absolute color balance.
Next you may want to read about SMART and Gamma Tracking.
Introduction to how SMART works
Frequently Asked Questions about SMART
Here is what's new is SMART III version 1.2
The Dummies Guide explains the SMART process in a non-technical way
Buy SMART III at EnhancedHT - your exclusive source for all SMART products
Having trouble? Learn the most common mistakes people make using SMART
Read about using bias lights to improve perceived black levels.
Here are some additional tips for the SONY projectors and solution to common problems.